

Statistics Calculator
Learn More About Statistics Calculator
CalculatorCrave statistics calculator is a reliable tool for determining essential statistical values quickly and efficiently. With the ability to calculate the median, mode, mean, and variance of any dataset, it is perfect for students, researchers, and professionals alike. Its user-friendly interface makes it easy to input your data and generate accurate results with just a few simple steps.
What is statistics?
Statistics is a branch of mathematics that deals with collecting, organizing, analyzing, interpreting, and presenting data. This field plays a crucial role in various industries such as finance, healthcare, marketing, and technology. It helps in making informed decisions, identifying trends, and solving complex problems.
The central of tendency (mean median and mode)
One of the key concepts in statistics is the central tendency, which includes the three main measures: mean, median, and mode.
Mean
\frac{\sum_{ }^{ }x}{n}
The mean is the average value of a set of data, calculated by adding all values and dividing by the total number of values.
Median
The median is the middle value when the data is arranged in ascending or descending order.
\frac{X\left[\frac{n}{2}\right]+X \left[\frac{n}{2}+1\right]}{2}
Mode
The mode is the most frequently occurring value in a dataset.
To calculate the mode of a dataset, you can use the following formula:
M_x=l+\left(\frac{f_1-f_0}{2f_1-f_0-f_2}\right)h
Where f_0, f_1, f_2 are the frequency count (the number of times each number appears in the dataset )
Breakdown of the variables
- l = the lower limit of the chosen modal class in the dataset
- h = the size of the modal class in the dataset
- f_1 = the number of times each number appears in the modal class of the dataset
- f_0 = the frequency of the class that precedes the modal class in the dataset
- f_2 = the frequency of the class that succeeds the modal class in the dataset
Follow this steps to calculate mode successfully
1. Count the frequency of each number in the dataset
2. Identify the number with the highest frequency
3. The number with the highest frequency is the mode of the dataset
Variance
Another important concept in statistics is variance, which measures how spread out the values in a dataset are from the mean.
\sigma^2=\frac{\sum_{ }^{ }\left(x-\overline{x}\right)^2}{n-1}
A higher variance indicates that the values are more spread out, while a lower variance suggests that the values are closer to the mean.
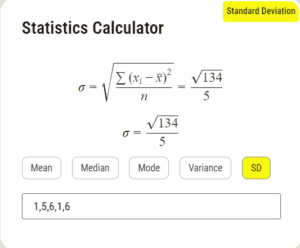
Standard deviation
Standard deviation is a statistical measure that is used to quantify the amount of variation or dispersion in a set of data points.
\sigma=\sqrt{\frac{\sum_{ }^{ }\left(x_i-\overline{x}\right)^2}{n}}
It gives an indication of how spread out the values in a dataset are from the mean, or average, of the data. In other words, it provides information on the typical distance between each data point and the mean.
The standard deviation is calculated by taking the square root of the variance. The variance is the average of the squared differences between each data point and the mean. By taking the square root of the variance, we get a measure of dispersion that is in the same units as the original data.
Why it matters
In the media industry, statistics are used to analyze ratings, audience demographics, and market trends to make programming decisions. For example, a TV network may use statistics to determine which shows are popular among certain age groups or demographics, and adjust their programming accordingly.
In the healthcare industry, statistics play a crucial role in analyzing patient data, conducting clinical trials, and predicting disease outbreaks. For instance, epidemiologists use statistics to track the spread of diseases and identify risk factors that can help in preventing future outbreaks.
Statistics is a powerful tool that helps in making sense of data, identifying patterns, and making informed decisions in various fields. Understanding key concepts like mean, median, mode, and variance is essential for analyzing and interpreting data accurately.
Examples
For example, consider a dataset of monthly incomes for a group of individuals: $2000, $3000, $4000, $5000, $6000. The mean income is ($2000 + $3000 + $4000 + $5000 + $6000) / 5 = $4000. The median income is $4000, which is the middle value. The mode income is $2000, as it occurs most frequently. The variance can be calculated by finding the difference between each income and the mean, squaring the differences, summing them up, and dividing by the total number of values.
Practice questions and answers
1) Question: Calculate the standard deviation for the following dataset: {5, 8, 10, 12, 15}
Answer: First, calculate the mean: (5 + 8 + 10 + 12 + 15) / 5 = 10,
then calculate the variance: ((5-10)^2 + (8-10)^2 + (10-10)^2 + (12-10)^2 + (15-10)^2) / 5 = (25 + 4 + 0 + 4 + 25) / 5 = 58 / 5 = 11.6.
Finally, calculate the standard deviation, which is the square root of the variance: √11.6 ≈ 3.41
2) Question: Find the median of the dataset: {21, 15, 29, 33, 17}
Answer: Arrange the data in ascending order: {15, 17, 21, 29, 33}.
Since there are an odd number of data points, the median is the middle number, which is 21 in this case.
3) Question: Determine the mode of the dataset: {7, 4, 9, 7, 3, 7, 5}
Answer: The mode is the number that appears most frequently in the dataset. In this case, the number 7 appears three times, making it the mode.
4) Question: Calculate the mean of the dataset: {12, 14, 18, 20, 22}
Answer: To find the mean, add all the numbers together and divide by the total number of data points: (12 + 14 + 18 + 20 + 22) / 5 = 86 / 5 = 17.2
5) Question: Calculate the variance for the dataset: {2, 4, 6, 8, 10}
Answer: First, calculate the mean: (2 + 4 + 6 + 8 + 10) / 5 = 6. Then, calculate the variance: ((2-6)^2 + (4-6)^2 + (6-6)^2 + (8-6)^2 + (10-6)^2) / 5 = (16 + 4 + 0 + 4 + 16) / 5 = 40 / 5 = 8.